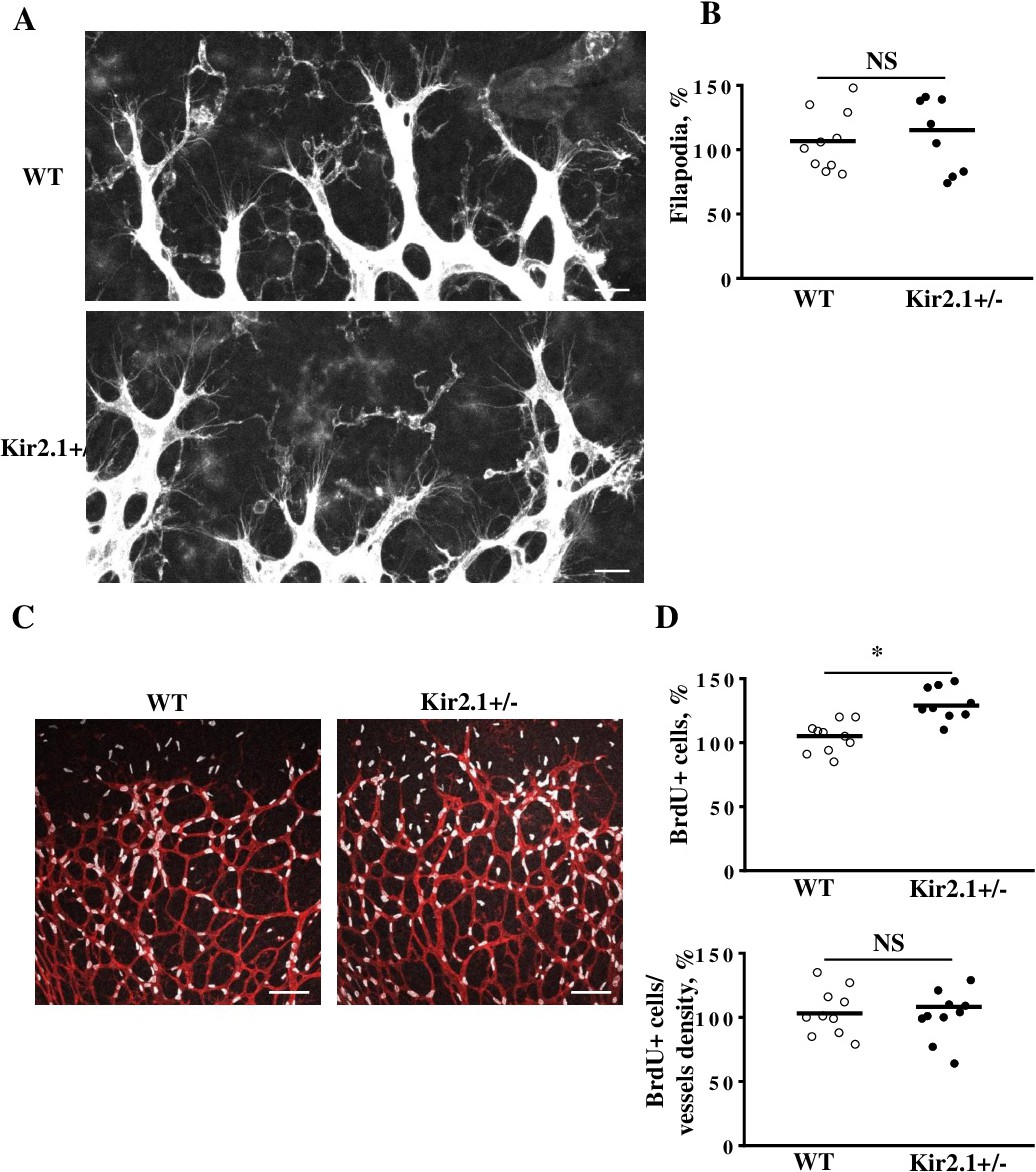
Fig. 2. Kir2.1 expression does not alter the number of filopodia and retinal cell proliferation. (A) Images of filapodia of Kir2.1+/- and WT retinas at P6 stained with IsoB4 (white). (B) Quantification of filopodia numbers in WT and Kir2.1+/- retinas as indicated. Each dot refers to the filopodia numbers of an individual mouse retina. (C) Images stained to identify proliferation of the retinal cells by BrdU labeling (white) of WT and Kir2.1 retinas. (D) Upper graph: The total number of BrdU positive cells increased in Kir2.1+/- group. Lower graph: BrdU positive cells normalized to total EC area (isolectin B4, red). Each dot refers to the parameter of an individual mouse retina. Data are means of at least six mice per group. *P˂0.05. "NS" means no significant differences. Scale bar panel A: 25 µm, panel C: 100 µm.